Intrinsic Value Calculator Icon $

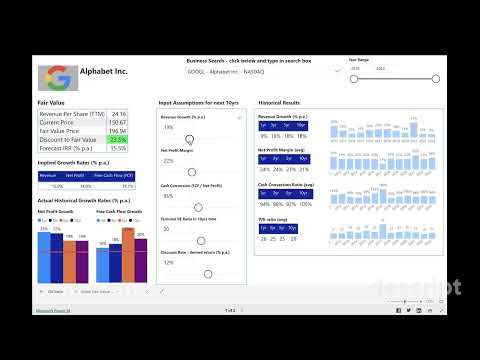
Intrinsic Value Calculator (DCF Tool)

Estimate a stock's intrinsic value with our powerful, free Discounted Cash Flow (DCF) Calculator. Use this essential stock valuation tool to determine fair value, avoid overpaying, uncover potential bargains, and make more informed, long-term investment decisions across global markets. Ready to find a stock's underlying worth?

What is Intrinsic Value & Why Calculate It?

Intrinsic value represents the true, underlying worth of a business – often called its fair value. It's the price an informed investor would pay based on fundamentals like financial health, cash generation, and growth potential. Unlike the constantly fluctuating market price, intrinsic value is an estimate derived from analysis.

Using an intrinsic value calculator, like our DCF tool below, allows you to:

  • Identify potentially undervalued stocks.
  • Avoid overpaying for overvalued stocks driven by market hype.
  • Make investment decisions based on objective analysis rather than emotion.
  • Establish a margin of safety, a key principle of value investing.
Intrinsic Value Calculator

How This Intrinsic Value Calculator Works (DCF Method)

This Intrinsic Value Calculator utilizes the widely-used Discounted Cash Flow (DCF) method to estimate a stock's fair value. This technique involves projecting a company's future Free Cash Flows (FCF) and discounting them back to their present value using your required rate of return.

For a comprehensive step-by-step explanation of the DCF analysis methodology itself, please read our detailed guide: DCF Analysis Explained.

The rest of this page focuses on how to use this specific DCF calculator tool and interpret its results effectively.

How to Use the Intrinsic Value Calculator (Quick Guide)

Intrinsic Value Calculator Demo: How to Value Stocks Like a Pro

Our DCF calculator estimates fair value based on your inputs:

  1. Search: Enter the company name or ticker symbol in the 'Business Search' below.
  2. Select Growth Driver: Choose Revenue, Earnings (EPS), or Free Cash Flow (FCF) growth as the basis for your projection.
  3. Select Projection Period: Choose your forecast timeframe (default 10 years, option for 5 years).
  4. Input Your Assumptions: Use sliders for Growth Rate, Margins (if applicable), Cash Conversion (if applicable), Terminal Multiple, and your required Discount Rate. Use the historical data displayed only as a guide – these inputs reflect your view of the future.
  5. Analyze Results: Instantly see the calculated Fair Value Price, Discount/Premium to the current market price, and the Forecast IRR.

Detailed instructions are available further down. For term definitions, see our Stock Investing Glossary.

Intrinsic Value Calculator Dashboard (DCF Tool)

Use this free stock valuation tool to perform DCF analysis and estimate intrinsic value. Data refreshes approximately every three hours.

💡 If you love using these free tools, please consider buying us a coffee or supporting via PayPal. ☕
Your support helps cover our costs for data, storage and compute.

Buy Me a Coffee Buy Me a Coffee Support via PayPal

We value your input! Please suggest improvements to this DCF calculator tool via the Contact page.

Disclaimer: This intrinsic value calculator provides an estimate based on the DCF model and user inputs. It is a guide only. Financial data accuracy is not guaranteed. The calculated fair value price depends heavily on your assumptions about future growth, margins, and discount rates. Past performance does not predict future results. Always perform thorough due diligence, including reviewing official company reports, before making any investment decisions.

Detailed Instructions for the Intrinsic Value Calculator

1. Business Search

  • Search for the desired business in the ‘Business Search’ dropdown using the search box. Select the company from the list.

Screenshot Example of Business Search

Business search screenshot

2. Entering Your Assumptions in the Calculator

a) Select Desired Growth Driver
  • At the top of the calculator, choose whether to base your valuation on forecast Revenue Growth, Earnings Growth (EPS), or Free Cash Flow (FCF) Growth.
  • Select the metric you are most comfortable forecasting. Note: If current EPS or FCF are negative, using Revenue Growth might be more appropriate.
b) Select Projection Period
  • Choose your forecast timeframe (default 10 years, option for 5 years) using the slicer tile.
c) Input Key Financial Metric Assumptions
  • Use the sliders under 'Projection Assumptions' to input your estimates for the future. (e.g., if using FCF growth, input expected FCF Growth %, Terminal P/FCF Ratio, and Discount Rate).
  • Use the historical data charts displayed only as a guide. These inputs represent your assumptions about the future.
d) Understand Financial Metrics
e) Analyze Implied Growth Rates (Sanity Check - If using Revenue or EPS drivers)
  • If basing your calculation on Revenue or EPS, check the 'Implied Growth Rates' table. This shows the FCF and EPS growth implied by your other assumptions (margins, conversion, terminal multiple).
  • Adjust inputs until these implied rates seem reasonable compared to the company's history and prospects. The red line on the historical charts shows your implied rate – does it appear plausible?
f) Set Your Discount Rate
  • Use the final slider to set your annual Discount Rate. This is your personal required rate of return. Adjust based on your risk assessment.
g) Tip: Be Conservative
  • Be realistic or slightly conservative, especially with growth rates and terminal multiples. High growth is hard to sustain. Research the business outlook thoroughly. See guidance below.
Intrinsic Value Calculator

3. Interpreting the Results

  • The 'Fair Value' table displays the outputs.
  • The 'Fair Value Price' is the calculated intrinsic value per share.
  • The 'Discount/Premium to Fair Value' highlights potential under/overvaluation.
  • The 'Forecast IRR' is the potential annual return. Compare this to your discount rate.

4. Other Information

  • Sensitivity Analysis: Vary key assumptions using the sliders to see the impact on the fair value price.
  • Device Viewing: Best viewed on desktop; use landscape mode on mobile.

Choosing Your DCF Assumptions: Guidance & Considerations

The accuracy of your DCF result hinges on the quality of your assumptions. Here's guidance on setting the key inputs:

Setting the Growth Rate (Revenue, EPS, or FCF)

This is often the most sensitive input. Consider:

  • Historical Performance: Use the 5- and 10-year CAGR rates displayed as a starting point, but don't blindly extrapolate.
  • Industry Outlook: Growing, mature, or declining?
  • Company Position: Does it have a strong economic moat?
  • Management Guidance: Consider company projections (treat with caution).
  • Be Conservative: High growth (>15-20%) is hard to sustain long-term. Assume moderation.

For a deeper dive, see our DCF Analysis Guide.

Selecting the Discount Rate (Your Required Return)

This rate reflects the return you need for the investment's risk and opportunity cost. Higher risk = higher rate = lower intrinsic value.

  • Risk Assessment: Consider debt, volatility, competition.
  • Market Benchmarks: Average market returns (~9-10%) offer a baseline.
  • Personal Hurdle Rate: Your minimum acceptable return.
  • Margin of Safety: Our default 12% includes a premium. Adjust based on confidence.

Learn more in our detailed DCF guide.

Determining the Terminal Multiple (P/E or P/FCF)

Estimates the valuation multiple at the end of your forecast. Higher multiple = higher intrinsic value today.

  • Historical Multiple: Examine the company's range in the charts.
  • Industry Norms: Compare with mature peers.
  • Future State: Slower-growing may mean lower multiple (12-15x); durable advantages might justify higher (18-20x+).
  • Conservatism: Default 15x is moderate. Test different multiples.

Understanding the Output: Intrinsic Value is an Estimate

It's vital to remember that the value calculated by this DCF tool is an estimate, not a precise prediction. The result is highly sensitive to your input assumptions.

  • "Garbage In, Garbage Out": Unrealistic assumptions yield unreliable results. Base inputs on thorough research.
  • Use Sensitivity Analysis: Test how the intrinsic value changes when you adjust key assumptions (growth, discount rate, terminal multiple) using the sliders. This establishes a potential valuation range.
  • Combine with Qualitative Factors: DCF is quantitative. Always supplement findings with analysis of management quality, economic moat, industry trends, and risks not captured in numbers.

Think of the DCF result as one valuable data point within your broader investment thesis, not the sole reason to buy or sell.

When is DCF Most (and Least) Effective?

DCF analysis works best for certain types of companies:

  • Most Suitable For: Businesses with relatively stable and predictable earnings and free cash flows (e.g., mature industries like consumer staples, some established tech). A history of positive FCF helps.
  • More Challenging For:
    • Startups / Unprofitable Companies: Highly speculative future cash flows.
    • Highly Cyclical Businesses: Difficult to predict cash flow swings accurately.
    • Financial Institutions (Banks, Insurers): Standard FCF-based DCF is less appropriate due to different business models and cash flow definitions.

For companies with current negative earnings or FCF, using the Revenue growth driver option in our calculator might provide a more stable starting point, but margin and cash conversion assumptions become even more critical.

Complementary Tools & Next Steps

This DCF calculator provides valuable quantitative insights but works best within a broader analysis process. Combine its results with:

  • Stock Screeners: Identify potential candidates before valuation. Try the Value Screener or Quality Screener.
  • Stock Analysis Dashboard: Review detailed historical financials to inform your DCF assumptions.
  • Reverse DCF Calculator: Cross-check by seeing what growth rate the market currently implies. Is it realistic compared to your DCF inputs?
  • Stock Investing Glossary: Define unfamiliar financial terms used in the analysis.
  • Qualitative Research: Crucially, always read the company's annual report (10-K), understand its business model, competitive landscape, and management quality.

Conclusion: Using the Intrinsic Value Calculator Effectively

Estimating a stock's intrinsic value is a cornerstone of disciplined investing. Our DCF Calculator provides a robust framework for calculating potential fair value based on your assumptions about future cash flow potential and your required return.

While no stock valuation tool is a crystal ball, using this calculator forces rigorous thinking about a company's prospects and helps identify potential margins of safety. Combine its quantitative output with qualitative research and sensitivity analysis to build a stronger investment thesis and increase your probability of long-term success.

Ready to Estimate Fair Value?

Put DCF analysis into practice. Use our free calculators to guide your investment decisions.

Use the Free Intrinsic Value Calculator Explore the Reverse DCF Calculator Learn More About DCF Methodology

Frequently Asked Questions (About This Calculator)

What if I enter unrealistic assumptions into the calculator?
The calculator will still produce a number, but it will be meaningless (""Garbage In, Garbage Out""). Always strive for realistic, defensible inputs based on research. Use the historical data and implied growth rates (if applicable) shown within the tool as important sanity checks before relying on the output.
How accurate is the 'Fair Value Price' from this calculator?
The result is an estimate, entirely dependent on the accuracy and reasonableness of your future projections (growth, margins, etc.). It is not a precise prediction. Best practice is to use the calculator to establish a potential value range by testing different reasonable scenarios (sensitivity analysis using the sliders), rather than fixating on a single number.
What's the difference between this Intrinsic Value Calculator and the Reverse DCF Calculator?
This calculator starts with your assumptions about future growth and calculates an estimated intrinsic value. The Reverse DCF Calculator works backward: it starts with the current market price and tells you the growth rate the market is implicitly expecting, allowing you to judge if those market expectations are realistic. They are complementary tools.
What if the historical growth rate shown in the tool is very high, low, or volatile?
Historical data is only a guide, not a guarantee for the future. If past growth was exceptionally high (e.g., >20-25% CAGR), it's often prudent to assume it will moderate. If it was low or volatile, investigate the reasons (cyclicality, past issues) and decide if future prospects warrant a different trajectory based on your research. Do not blindly extrapolate extreme historical rates into the future assumptions.
How does this calculator account for a company's debt?
This DCF model primarily accounts for debt implicitly. When using FCF or Earnings as drivers, these figures are typically calculated after interest expense has been paid. Additionally, higher debt levels increase financial risk, which should influence your choice of a higher personal Discount Rate.
Can I use this calculator for non-US stocks?
Yes, absolutely. If you can find the company using the 'Business Search' function (which covers over 35,000 global stocks), you can perform the DCF analysis. Ensure you understand any currency implications.
Where can I learn more about the DCF method itself?
For a detailed breakdown of the theory and steps behind Discounted Cash Flow analysis, please see our comprehensive guide: DCF Analysis Explained.

How can we help you better?

Please tell us what improvements would make your experience on our website better? Feel free to provide details!