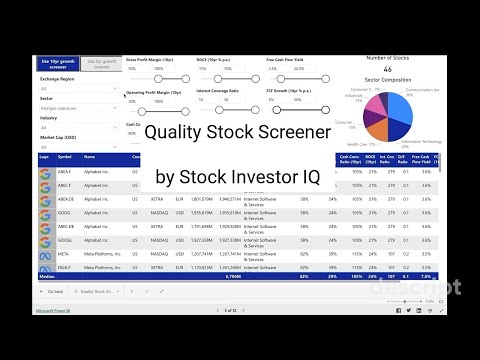
Quality Stock Screener using Terry Smith Metrics

In the world of investing, few names command as much respect and admiration as Terry Smith, the founder of Fundsmith. Known for his long-term and highly successful investment philosophy, Smith has developed a distinct approach to stock selection. This approach leverages a specific set of metrics, utilised in our Quality Stock Screener, to identify high-performing stocks.  

Our Quality Stock Screener has up-to-date data for more than 25,000 global stocks, spanning the United States, India, Europe, Canada, Korea, Australia, Japan, China and more. Click here to explore our expansive country and exchange coverage. Scroll down to our Quality Stock Screener Dashboard to begin your journey in identifying promising quality stocks both domestically and internationally.

Terry Smith's Investment Philosophy

Terry Smith follows a long-term investment strategy with a particular focus on quality. He generally invests in businesses that have the potential to generate high return on capital employed (ROCE) and demonstrate sustainable advantages over the competition. Terry Smith’s approach has been highly successful, with the Fundsmith Equity Fund delivering strong performance since its inception. 

Key principles of Terry Smith’s investment philosophy include:

  1. Buy Good Companies: Smith focuses on companies with a high ROCE, good cash conversion, robust margins, and resilient business models. He prefers companies that offer everyday products or services that customers habitually buy, indicating strong customer retention and predictable earnings.

  2. Don’t Overpay: Smith adheres to the principle of not overpaying for companies, even high-quality ones. He often refers to a moderate free cash flow yield as an indication of a fair price.

  3. Do Nothing: Smith is a long-term investor. He believes in the power of compounding and prefers to hold onto his investments for as long as possible, instead of frequently buying and selling.

Smith avoids sectors and industries which generate a low Return on Capital Employed (ROCE) and therefore cannot generate sustainable profits. These include:

  • Banks and Financial Services: Due to their complexity and the opaque nature of their balance sheets.

  • Commodities and Resource Firms: These companies are typically price takers, not price makers, and are heavily dependent on fluctuating commodity prices which are beyond their control.

  • Utilities and Telecommunications: These are often heavily regulated and can have limited growth prospects. 

Key Quality Metrics in Terry Smith's Stock Selection

Our Quality Stock Screener utilizes a number of financial metrics which provide a comprehensive view of a business’s financial health, profitability, and growth potential.

1. Gross Profit Margin

Gross Profit Margin measures the proportion of revenue remaining after deducting the cost of goods sold (COGS).

Gross Profit Margin = Gross Profit / Revenue

Terry Smith favors companies with high gross margins. This measure reveals a business’s profitability, pricing strategy, cost control, and can be used for benchmarking against peers. A high gross profit margin suggests a business is efficient, profitable, and well-managed.

2. Operating Profit Margin

Operating Profit Margin measures the proportion of revenue remaining after deducting operating expenses.

Operating Profit Margin = Operating Profit / Revenue

where:

Operating Profit = Gross Profit – Operating Expenses – Depreciation and Amortization

This metric indicates a business’s profitability after all variable costs, but before interest and taxes. It provides insights into how well a business manages both its direct costs and operating expenses. A high operating profit margin suggests a business is efficient at converting revenue into pre-tax profit.

3. Cash Conversion Ratio

Cash Conversion Ratio measure how effectively a business turns its profits into cash.  It is calculated as free cash flow divided by net profit. 

Cash Conversion Ratio = Free Cash Flow / Net Profit

For Smith, a high cash conversion ratio suggests a business that can effectively translate its sales into actual cash, providing it with more liquidity. Companies with a strong cash conversion ratio may be better positioned to weather economic downturns, invest in growth, or distribute returns to shareholders.

4. Return on Capital Employed (ROCE)

Return on Capital Employed (ROCE) measures a business’s profitability and the efficiency with which its capital is employed. It is calculated by dividing earnings before interest and taxes (EBIT) by capital employed (the sum of shareholders’ equity and debt liabilities).

ROCE = EBIT / Capital Employed

Terry Smith uses ROCE to assess how well a business is using its capital to generate profits. It helps him identify companies that are effective at turning capital into profits, a key indicator of long-term growth potential.

5. Interest Coverage Ratio

Interest Coverage Ratio measures a business’s ability to handle its debt obligations. It is calculated by dividing a business’s Earnings Before Interest & Taxes (EBIT) by its interest expenses,.

Interest Coverage Ratio = EBIT / Interest Expenses

Smith uses this ratio to assess a business’s debt sustainability. A higher ratio suggests that the business is more capable of meeting its interest obligations, which reduces the risk of financial distress or bankruptcy.

6. Debt / Equity Ratio

Debt / Equity Ratio measures a business’s financial leverage.  It is calculated by dividing a business’s total debt by its shareholders’ equity.

Debt / Equity Ratio = Total Debt / Shareholder’s Equity

Smith favors a lower debt/equity ratio as it often indicates a more financially stable business, with a lower risk of insolvency. Such companies may be better positioned to withstand economic downturns.

7. Free Cash Flow Yield

Free Cash Flow Yield is used by Terry Smith to assess the value of the business.  It is calculated by dividing the business’s free cash flow by its market capitalization.

Free Cash Flow Yield = Free Cash Flow / Market Capitalization

For Terry Smith, free cash flow yield provides a more realistic view of a business’s financial health and profitability than traditional earnings or dividend yields. It’s based on the actual cash a business generates, rather than reported earnings, which may be subject to various accounting adjustments.

8. Free Cash Flow Growth

Free Cash Flow Growth measures the increase in a business’s free cash flow, highlighting its growing ability to generate cash from operations. This metric is key for assessing a company’s efficiency, profitability, and financial health, indicating its potential for sustainable growth and value creation. While Terry Smith does not explicitly highlight this as a key metric, the metric aligns with his investment philosophy which is focused on high-quality businesses with strong financial fundamentals.

How to use the Quality Stock Screener

Quality Stock Screener Demo: Find High-Quality Stocks Quickly

Click on the video and expand to full screen to view a demo of the Quality Stock Screener.

Detailed instructions are also provided below the dashboard.

If you need a refresher on any of the financial metrics used, our Stock Investing Glossary is just a click away.

Our Quality Stock Screener has the default settings below.  You may adjust these settings in the screener to suit your specific criteria.
  • Screens using growth rates and averages over the last 10 years.  There is the option to screen using growth rates and averages over the last 5 years, if you wish to focus more on recent performance.
  • Exchange Region is ‘All’
  • Sector is limited to: Communication Service, Consumer Discretionary, Consumer Staples, Health Care, Industrials & Information Technology
  • Market Cap (USD) is ‘All’
  • Gross Profit Margin (average for selected period) > 50%
  • Operating Profit Margin (average for selected period) > 20%
  • Cash Conversion Ratio (average for selected period) > 80%
  • ROCE (Return on Capital Employed) over selected period > 15% p.a.
  • Interest Coverage Ratio > 10
  • Free Cash Flow Yield > 3.5%
  • Free cash flow growth over selected period > 5% p.a.
  • Discount to Fair Value using historical free cash flow growth (growth capped at 20% p.a., discount rate = 12%, terminal P/FCF = 15) > 5%

The screener also provides the option to filter based on the Debt / Equity Ratio.  This is not used by default as it can sometimes screen out businesses which have relatively low shareholder’s equity due to stock buy-backs. It may be activated by moving the slider to suit your desired criteria, eg. a Debt / Equity ratio less than 1 is reasonable.

To better understand the meaning of these financial metrics, refer to our Stock Investing Glossary.

Quality Stock Screener Dashboard

Please suggest improvements to this dashboard by providing feedback in the form on the Contact page.

Detailed instructions for the Quality Stock Screener

  • By default, stocks for exchanges in ‘All’ regions are displayed initially.  You may select a specific region using the ‘Exchange Region’ drop down list.  Note that clicking on ‘Select all’ in the drop down list can also deselect all.
  • Select from the dropdown menus and move the circular sliders to apply your desired criteria.
  • By default, the stocks are sorted in descending order of market capitalisation (USD).  However you may sort the stocks based on another metric by clicking on the relevant column header.
  • All metrics in the table are current or based on trailing twelve months (ttm).
  • Obtain more information for a particular business by selecting Stock Metrics in the menu.
  • Estimate the fair value of a particular business by selecting Intrinsic Value Calculator in the menu.
  • The dashboard is best viewed on a desktop device. For the best mobile phone experience, view the dashboard using landscape orientation.

The accuracy of the data in this website is not guaranteed and it is highly recommended that you perform your own due diligence before making an investment decision by directly reviewing the business’s annual report and accompanying financial statements.

Potential Pitfalls and Limitations

While the Quality Stock Screener is a powerful tool for guiding investment decisions, it is not infallible. Investment always carries inherent risk, and not all risks can be captured by financial metrics alone. It’s crucial for investors to perform in-depth research to fully understand the business. Investors should consider the full range of financial and non-financial factors that could affect a business’s performance.

References and Further Reading

For those interested in delving deeper into Terry Smith’s investment philosophy and methods, several resources are available. Books like “Investing for Growth: How to make money by only buying the best companies in the world” by Terry Smith, articles in reputable financial publications, and interviews featuring Smith can provide further insights into his successful approach to investment. Continuous learning is a cornerstone of successful investing.

How can we help you better?

Please tell us what improvements would make your experience on our website better? Feel free to provide details!