
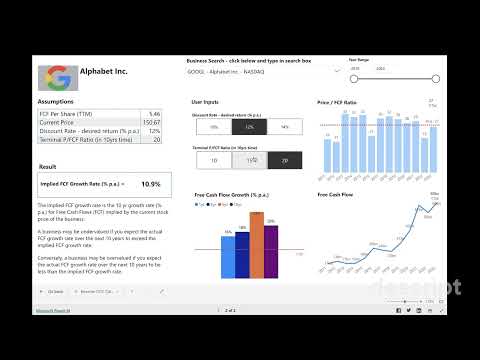
Reverse DCF Calculator
What growth is the market pricing in? Our free Reverse DCF Calculator works backward from the current stock price to reveal the implied growth rate the market expects. Use this powerful stock valuation reality check to see if market expectations align with your own analysis before investing.

 Buy Me a Coffee
