Quality Stock Screener Icon

Quality Stock Screener Tool

Find exceptional businesses built to last with our free Quality Stock Screener. Inspired by Terry Smith's proven approach, this tool filters global stocks focusing on companies demonstrating high ROCE, strong cash generation, and durable economic moats. Discover stocks potentially poised for consistent, long-term compounding.

Terry Smith’s Investment Philosophy

Terry Smith follows a long-term investment strategy focusing on quality. He invests in businesses with high Return on Capital Employed (ROCE) and sustainable competitive advantages. Key principles include:
  1. Buy Good Companies: Focus on high ROCE, good cash conversion, robust margins, and resilient business models (often everyday products/services).
  2. Don’t Overpay: Avoid paying excessive prices, even for quality. Considers free cash flow yield as a valuation indicator.
  3. Do Nothing: Hold investments long-term to benefit from compounding, minimizing trading.
medirectalk 28 March 2019 featuring Terry Smith - Fundsmith LLP

Smith avoids sectors typically generating low ROCE, such as banks, commodities, utilities, and telecoms.

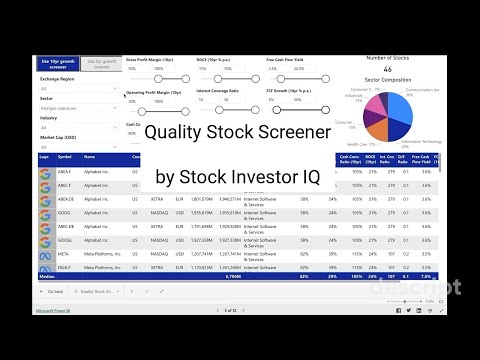
Key Metrics for Quality Stock Screening

This Quality Stock Screener uses adjustable filters based on metrics that help identify businesses with characteristics favored by quality-focused investors like Terry Smith. Here’s why these specific dashboard filters are relevant:

1. Profitability & Efficiency Metrics: (Core indicators of a high-quality business)

  • Gross Profit Margin (10yr): Filters for companies with consistently high margins, suggesting strong competitive positioning.
  • Operating Profit Margin (10yr): Filters based on profitability from core operations, indicating effective management of operating expenses.
  • ROCE (10yr % p.a.): A primary filter for quality, measuring how effectively a company uses its total capital (debt + equity) to generate operating profit. High ROCE is a hallmark of efficient, valuable businesses.
  • Cash Conversion Ratio (10yr): Filters for companies efficient at converting profits into free cash flow, essential for funding growth and returns without excessive borrowing.

2. Financial Health Metric: (Assessing resilience)

  • Interest Coverage Ratio: Screens for companies easily able to cover debt interest payments, indicating lower financial risk, crucial for long-term holdings.
  • Debt / Equity Ratio: Allows filtering based on leverage; lower ratios generally signify greater financial stability. (Use with caution as buybacks can distort equity).

3. Growth & Valuation Metrics: (Finding quality at a reasonable price)

  • FCF PS Growth (10yr % p.a.): Filters for growth in free cash flow per share, supporting the company’s ability to compound value.
  • Free Cash Flow Yield: A crucial valuation filter for this strategy, helping ensure the purchase price is reasonable relative to the cash the business generates.
  • Discount to Fair Value (FCF): Provides a supplementary valuation check based on historical FCF growth, ensuring the price isn’t excessively high relative to a DCF-based estimate.

By combining these filters, the screener aims to identify businesses that are not only profitable and efficient but also financially sound and potentially available at a reasonable valuation.

How to use the Quality Stock Screener

Quality Stock Screener Demo: Find High-Quality Stocks Quickly

Watch the video (expand to full screen) for a demo. Detailed instructions are also below the dashboard.

Need a refresher on metrics? Our Stock Investing Glossary can help.

Default Settings & Customization

Our Quality Stock Screener applies default settings inspired by Terry Smith's quality focus. Key default filters include:

You can customize your screen by adjusting the available sliders in the dashboard below and using the dropdown filters for Region, Sector, Industry, and Market Cap.

Quality Stock Screener Dashboard

Our data refreshes approximately every three hours. Bookmark this page to identify potential quality investment opportunities. For more metrics or offline analysis, use our 'All-in-One Excel Screener'.

💡 If you love using these free tools, please consider buying us a coffee or supporting via PayPal. ☕
Your support helps cover our costs for data, storage and compute.

Buy Me a Coffee Buy Me a Coffee Support via PayPal

Please suggest improvements to this dashboard via the Contact page.

Disclaimer: Data accuracy is not guaranteed. Always perform your own due diligence by reviewing official company reports before investing.

Detailed Instructions for the Quality Stock Screener

References and Further Reading

For those interested in delving deeper into Terry Smith's investment philosophy and methods, resources like his book Investing for Growth, articles, and interviews can provide further insights. Continuous learning is a cornerstone of successful investing.

Found Potential Quality Stocks?

Take the next step by performing in-depth analysis and valuation on your shortlisted candidates.

Analyze Company Fundamentals Calculate Intrinsic Value

Quality Screener Specific FAQs

Why does this screener focus on ROCE instead of ROIC?
Return on Capital Employed (ROCE) is a key metric favored by investor Terry Smith, whose philosophy inspires this screener. It measures profitability against all long-term capital (debt + equity), providing a broad view of capital efficiency.
What is considered a 'good' Free Cash Flow Yield for quality companies?
Terry Smith often suggests a moderate FCF Yield (e.g., above 3-4% but not excessively high, which might indicate low growth) indicates a potentially reasonable price for a quality business. The screener default is > 3.5%, but this should be assessed relative to prevailing interest rates and the company's growth prospects.

For general questions about using screeners, interpreting results, or limitations, please see our main guide: Guide to Using Stock Screeners FAQs.

How can we help you better?

Please tell us what improvements would make your experience on our website better? Feel free to provide details!