Reverse DCF Calculator Icon ?

Reverse DCF Calculator

What growth is the market pricing in? Our free Reverse DCF Calculator works backward from the current stock price to reveal the implied growth rate the market expects. Use this powerful stock valuation reality check to see if market expectations align with your own analysis before investing.

Reverse DCF Explained: Uncovering Market Expectations

Unlike traditional DCF (Discounted Cash Flow) analysis which estimates value from future projections, the Reverse DCF Calculator works backward. It starts with the current stock price and asks: ‘What implied growth rate in Free Cash Flow (FCF) does this price require, given my required return?’ This unique approach provides a powerful reality check on market sentiment and the growth expectations embedded in a stock’s price.

Here’s the key difference:

Reverse DCF Calculator

"The stock market is filled with individuals who know the price of everything, but the value of nothing."

Philip Fisher (adapted)

By using the Reverse DCF Calculator, investors can gauge whether the market’s growth expectations are realistic, overly optimistic, or perhaps even pessimistic compared to their own analysis. This is invaluable for identifying potential mispricings.

How to Use the Reverse DCF Calculator

Reverse DCF Calculator Demo: Unveiling Market Growth Expectations

Follow these simple steps. For definitions, hover over underlined terms or visit our Stock Investing Glossary.

  1. Search for the Business: Enter the company name or stock symbol in the 'Business Search' dropdown within the dashboard below.
  2. Select Projection Period: Choose whether you want to calculate the implied growth over a 5-year or 10-year period by selecting the relevant slicer tile (default is 10 years).
  3. Set the Terminal Multiple (P/FCF): Input the expected Price-to-Free Cash Flow ratio you anticipate at the end of your chosen projection period (5 or 10 years) by selecting the relevant slicer tile. Use the historical P/FCF chart for context.
  4. Set Your Discount Rate: Input your required annual rate of return (e.g., 10%, 12%, 14%) by selecting the relevant slicer tile.
  5. Analyze the Output: The calculator instantly displays the Implied FCF Growth Rate (% p.a.) for the selected period.
  6. Compare and Assess (Crucial Step): Compare the calculated implied growth rate for the chosen period (5 or 10 years) to the company's historical FCF growth and your own assessment of its realistic future prospects over that same timeframe. Does the implied rate seem achievable?

Detailed instructions and interpretation guidance are available further down.

Reverse DCF Calculator Dashboard

Use this free tool to uncover the market's implied growth expectations for any stock. Data refreshes approx. every three hours.

💡 If you love using these free tools, please consider buying us a coffee or supporting via PayPal. ☕
Your support helps cover our costs for data, storage and compute.

Buy Me a Coffee Buy Me a Coffee Support via PayPal

We value your input! Please suggest improvements to this dashboard via the Contact page.

Disclaimer: The Reverse DCF Calculator is an analytical tool providing an implied growth rate estimate based on current market price and user inputs (discount rate, terminal multiple). It is a guide only. Financial data accuracy is not guaranteed. Historical data may not predict future performance. Always perform thorough due diligence before making investment decisions.

Detailed Instructions for the Reverse DCF Calculator

1. Business Search

  • Search for the desired business in the ‘Business Search’ dropdown using the search box. Select the company from the list.

Screenshot Example of Business Search

Business search screenshot

2. Select Projection Period

  • Use the slicer tiles within the dashboard to choose between a 5-year or 10-year projection period for the calculation. The default is 10 years.

3. User Inputs (Setting the Context for the Chosen Period)

  • Discount Rate: Use the slicer tiles to select your required annual rate of return. This sets the hurdle rate against which the implied growth (over your chosen 5 or 10 year period) is calculated.
  • Terminal P/FCF Ratio: Use the slicer tiles to set the expected P/FCF multiple at the end of your chosen 5 or 10 year period. Use the historical P/FCF chart for context.

4. Interpreting the Results (for the Chosen Period)

  • The Implied FCF Growth Rate (% p.a.) is the key output. It shows the annual growth in FCF per share required over the next 5 or 10 years (whichever you selected) for the stock's discounted future value to equal its current market price.
  • Crucially, compare this implied rate to the company's historical FCF growth rates and your qualitative assessment of its future prospects over the same 5 or 10 year timeframe.
    • If Implied Growth > Realistic Growth Potential (for that period): Stock might be overvalued.
    • If Implied Growth < Realistic Growth Potential (for that period): Stock might be undervalued.

5. Other Information

  • Sensitivity Analysis: Adjust the discount rate and terminal multiple sliders to see how the implied growth rate changes for your selected projection period.
  • Device Viewing: Best viewed on desktop; use landscape mode on mobile.

Interpreting the Implied Growth Rate (In Detail)

The calculated Implied FCF Growth Rate is the core output. Here’s how to analyze it effectively, keeping your chosen projection period (5 or 10 years) in mind:

  • Compare to History: How does the implied rate stack up against the company's 5-year and 10-year historical FCF growth rates shown in the chart? Is the implied 5-year rate comparable to recent 5-year history? Is the implied 10-year rate sustainable compared to longer-term history?
  • Assess Realism (Your Judgement): Is this growth rate realistically achievable over the specific 5 or 10 year period you selected? Consider company size, industry maturity, economic moat, etc. Sustaining very high growth is significantly harder over 10 years than over 5 years.
  • Incorporate Qualitative Factors: Do management, innovation, or market share gains support the implied growth over the chosen timeframe? Or do headwinds make it seem too high for that duration?
  • Identify Potential Mispricing:
    • If the implied growth rate seems unrealistically high for the selected period -> The stock might be overvalued.
    • If the implied growth rate seems conservatively low for the selected period -> The stock might be undervalued.

Using both the 5-year and 10-year implied rates provides additional context for the market's short-term vs. longer-term expectations.

Choosing Your Reverse DCF Assumptions (In Detail)

Even though this calculator solves for growth, your inputs for the discount rate and terminal multiple are critical because they set the parameters for that calculation. They define the required return and future valuation context against which the implied growth is measured.

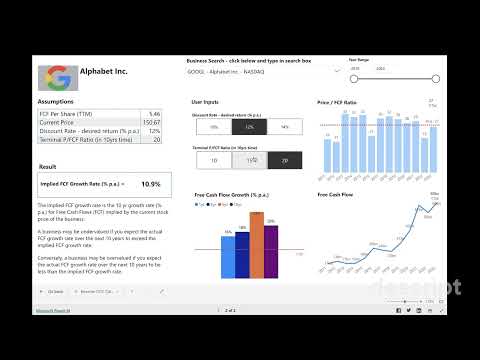
Selecting the Discount Rate

This still represents your personal required rate of return. Setting a higher discount rate means you demand more return for the risk, which forces the calculated implied growth rate higher to justify the current price. A lower discount rate requires less implied growth.

  • Use the same logic as in traditional DCF: consider risk, opportunity cost, market benchmarks.
  • Test different rates (e.g., 10%, 12%, 14%) using the slider to see the impact on the implied growth.

Refer to our DCF Analysis Guide for more on choosing discount rates.

Determining the Terminal P/FCF Multiple

This reflects the expected valuation multiple (Price / FCF) at the end of the forecast period. A higher terminal multiple assumes the market will value future cash flows more richly, thus requiring less implied growth today. A lower terminal multiple requires more implied growth.

  • Use historical P/FCF charts in the tool as a reference point.
  • Consider long-term prospects: a mature, slower company might warrant 12-15x; one maintaining advantages might justify 15-18x+.
  • Using a conservative (lower) terminal multiple provides a stricter test. Test different multiples using the slider.

Limitations and Considerations

While powerful, the Reverse DCF Calculator has limitations:

  • Sensitivity to Inputs: The implied growth rate is highly sensitive to your chosen discount rate and terminal multiple. Small changes can lead to significantly different growth requirements.
  • Market Price Dependency: The calculation starts with the current market price. If the market price itself is irrational (due to hype or panic), the implied growth rate will reflect that irrationality.
  • Assumes Constant Growth: The simplified model assumes a constant growth rate over the period, which may not reflect real-world business cycles.
  • Ignores Qualitative Factors: Like traditional DCF, it doesn't inherently account for management changes, competitive shifts, or unforeseen events.
  • Best Use Case: Generally more reliable for companies with a history of positive and somewhat stable free cash flow, making the comparison to historical growth meaningful.

Use Reverse DCF as one tool among others, not in isolation.

Reverse DCF vs. Traditional DCF: When to Use Which

These tools serve complementary purposes:

  • Use Traditional DCF (Intrinsic Value Calculator) when: Your primary goal is to estimate the stock's fundamental worth based on your own projections. You want to determine what you think it's worth.
  • Use Reverse DCF (This Tool) when: Your primary goal is to understand what the market is thinking. You want to see if the growth expectations already baked into the current price are reasonable or excessive, acting as a sanity check.

Best Practice: Use both! Calculate your own intrinsic value using the Intrinsic Value Calculator. Then, use the Reverse DCF Calculator to see what growth the market expects. Comparing your estimate and the market's implied expectations provides a much richer basis for decision-making.

Complementary Tools & Next Steps

The Reverse DCF Calculator provides valuable insights into market expectations but works best as part of a broader analysis process. Consider these actions:

  • Estimate Your Own Value: Use our Intrinsic Value Calculator. Input your own growth and margin assumptions to calculate a fair value estimate. How does it compare to the current price and the market's implied growth?
  • Find Candidates: Start with our Stock Screeners (e.g., Value, Quality, Growth) to identify companies meeting specific financial criteria. Then, use the Reverse DCF on those candidates as a valuation check.
  • Review Fundamentals: For any stock of interest, dive into the Stock Analysis Dashboard to examine detailed historical financials (revenue, earnings, cash flow, margins, ROIC, debt levels).
  • Define Terms: Unsure about a metric? Consult the Stock Investing Glossary.
  • Read Company Reports: Always supplement tool-based analysis by reading the company's latest annual report (10-K) and quarterly reports (10-Q) for management discussion and risk factors.

Challenge Market Assumptions

Use the Reverse DCF as a reality check. See if the growth priced into stocks aligns with fundamental potential.

Use the Reverse DCF Calculator Compare with Intrinsic Value Calc Understand DCF Methods

Frequently Asked Questions (About Reverse DCF)

When should I use the 5-year vs. 10-year projection period?
  • Use the 5-year period when you want to assess shorter-term market expectations or when forecasting beyond 5 years feels highly uncertain (e.g., for faster-changing industries or companies undergoing significant transitions).
  • Use the 10-year period (the default) for a more traditional long-term valuation perspective, better suited for stable businesses where longer-term trends are more relevant. Comparing the results from both periods can reveal if the market expects high growth to persist long-term or only short-term.
What does a high implied growth rate from Reverse DCF mean?
A high implied growth rate (e.g., >20-25% sustained for the chosen period) suggests the market has very optimistic expectations. You need to determine if such high growth is realistic over that specific timeframe. If not, the stock may be overvalued.
What if the implied growth rate is negative?
A negative implied growth rate means the market expects FCF per share to decline over the chosen period to justify the current price (given your inputs). This could indicate deep pessimism, potential issues, or possibly undervaluation if you believe FCF will actually grow or remain stable.
How sensitive is Reverse DCF to the terminal multiple?
It is quite sensitive. A higher assumed terminal multiple lowers the required implied growth rate today, and vice versa. Always test different reasonable terminal multiples (using the slider and historical context) to see the impact.

How can we help you better?

Please tell us what improvements would make your experience on our website better? Feel free to provide details!