Value Stock Screener Icon $

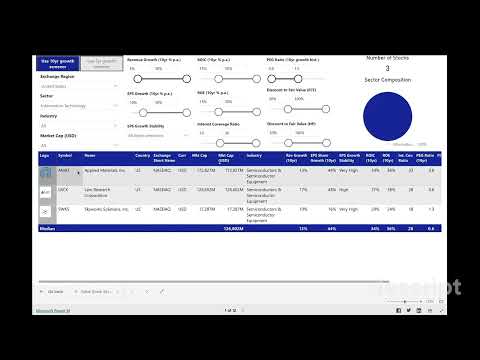
Value Stock Screener Tool

Find potentially undervalued companies globally using our free Value Stock Screener. Inspired by the timeless value investing principles of legends like Warren Buffett and Peter Lynch, this tool helps you filter over 35,000 stocks based on key fundamentals to identify quality businesses trading at an attractive price, offering a potential margin of safety.

Warren Buffett's Value Investing Philosophy

Buffett, known for his value investing philosophy, focuses on businesses with strong fundamentals and long-term growth potential. He emphasizes:

  • Strong Business Models: Buffett prefers businesses with a lasting competitive advantage (economic moat).
  • Financial Health: He looks for companies with high returns on capital, low debt, and consistent profitability.
  • Management Quality: Values skilled leadership demonstrating integrity and prioritizing shareholder interests.
  • Fair Valuation: Focused on acquiring stocks below their intrinsic value, emphasizing patience and a margin of safety.
Warren Buffett

Peter Lynch's Value Investing Philosophy

Lynch, famous for managing the Magellan Fund, advocates investing in what you know. His key points include:

  • Know What You Own: Invest in companies you understand or experience personally.
  • Growth at a Reasonable Price (GARP): Focuses on businesses with sustainable growth prospects but not overpriced.
  • Business Quality: Emphasized sustainable earnings growth, low debt, and strong management.
  • The Ten-Bagger Potential: Lynch sought investments that could grow tenfold, holding winners long-term.
Peter Lynch

Key Metrics in the Value Stock Screener

This Value Stock Screener dashboard allows you to filter stocks using adjustable criteria often emphasized in value investing. Here’s why the specific metrics you can filter on this dashboard are relevant: 1. Growth Metrics: (Assessing sustainable growth, important for increasing intrinsic value)
  • Revenue Growth (10yr % p.a.): Slider allows filtering for companies with consistent top-line growth, indicating market demand and expansion capability.
  • EPS Growth (10yr % p.a.): Filters for companies demonstrating consistent bottom-line profitability growth, a key factor for long-term investors like Buffett and Lynch.
  • EPS Growth Stability: Dropdown allows selection based on the consistency of past earnings growth. Value investors prefer predictable earnings.
2. Profitability & Efficiency Metrics: (Identifying high-quality businesses)
  • ROIC (10yr % p.a.): Filters based on the return generated from capital invested in core operations. High, consistent ROIC is a hallmark of quality businesses favored by investors like Buffett.
  • Cash Conversion Ratio (10yr): Filters based on the company’s ability to convert accounting profits into spendable free cash flow, indicating financial health and earnings quality.
3. Financial Health Metric: (Assessing risk)
  • Interest Coverage Ratio: Filters for companies that can comfortably cover their interest expenses with operating profits, indicating lower financial risk, a key consideration for value investors.
4. Valuation Metrics: (Finding an attractive purchase price relative to growth and value)
  • PEG Ratio (10yr growth hist.): Balances the P/E ratio with past earnings growth. Allows filtering for potentially undervalued growth stocks (Growth at a Reasonable Price – GARP).
  • Discount to Fair Value (FCF): Screens for stocks potentially trading below their estimated intrinsic value based on historical Free Cash Flow growth, targeting a margin of safety.
  • Discount to Fair Value (NP): Screens for stocks potentially trading below their estimated intrinsic value based on historical Net Profit growth, providing another perspective on the margin of safety.

Important: This screener uses the adjustable filters above alongside dropdowns for Region, Sector, Industry, and Market Cap. Remember that quantitative screening is just the first step; always conduct thorough qualitative research on any promising candidates

How to use the Value Stock Screener

Value Investing Stock Screener Demo: Find Undervalued Stocks Quickly

Watch the video above (expand to full screen) for a demo. Detailed instructions are also below the dashboard.

Need a refresher on metrics? Our Stock Investing Glossary can help.

Default Settings & Customization

Our Value Stock Screener applies default settings inspired by value investing principles, combining multiple data points. Key default filters include:

You can customize your screen by adjusting the available sliders in the dashboard below (e.g., for Margins, ROCE, FCF Growth, FCF Yield, Debt/Equity, Cash Conversion, Interest Coverage, Discount to FV) and using the dropdown filters for Region, Sector, Industry, and Market Cap.

Value Stock Screener Dashboard

Our data refreshes approximately every three hours. Bookmark this page to identify potential value opportunities regularly. For more metrics or offline analysis, use our 'All-in-One Excel Screener'.

💡 If you love using these free tools, please consider buying us a coffee or supporting via PayPal. ☕
Your support helps cover our costs for data, storage and compute.

Buy Me a Coffee Buy Me a Coffee Support via PayPal

Please suggest improvements to this dashboard via the Contact page.

Disclaimer: Data accuracy is not guaranteed. Always perform your own due diligence by reviewing official company reports before investing.

Detailed Instructions for the Value Stock Screener

  • Select Timeframe: Use the buttons (‘Use 10yr growth screener’ / ‘Use 5yr growth screener’) at the top left to choose the historical period (10 years or 5 years) for growth and average metric calculations used in filtering and displayed in the results table.
  • Filter by Categories: Use the ‘Exchange Region’, ‘Sector’, ‘Industry’, and ‘Market Cap (USD)’ dropdown lists to narrow your search geographically or by business type. Select specific options or leave as ‘All’.
  • Apply Quantitative Criteria: Adjust the circular sliders for the metrics available on this dashboard. Examples include:
  • Filter by Growth Stability: Use the ‘EPS Growth Stability’ dropdown to select companies based on the historical consistency of their earnings growth (e.g., Very High, High, Medium).
  • Sorting Results: Click on any column header in the results table (e.g., ‘ROIC (10yr)’, ‘PEG Ratio (10yr)’, ‘Discount to Fair Value (FCF)’) to sort the filtered stocks based on that metric (ascending or descending). The default sort is by Market Cap (descending).
  • Understanding Table Data: Metrics in the results table are generally current (TTM) or based on the selected historical period (10yr or 5yr averages/CAGR) as indicated in the column headers.
  • Further Analysis: For deeper insights into a specific company found via the screener, use the Stock Analysis dashboard or estimate its intrinsic value with the Intrinsic Value Calculator (available from the main menu).
  • Optimal Viewing: The dashboard is best viewed on a desktop device. For the best mobile experience, please use landscape orientation.

Why Use a Value Stock Screener?

Are you tired of spending countless hours sifting through stocks? An online stock screener simplifies your search:

Time-Saving Efficiency:

Quickly filter thousands of global stocks to pinpoint those matching your criteria, saving time for deeper analysis on promising opportunities.

Customizable Criteria:

Tailor your search using factors like market capitalization, P/E ratio, ROIC, and more to find stocks fitting your unique value investing approach.

Comparative Analysis:

Easily compare metrics across potential investments to spot relatively undervalued opportunities within industries or peer groups.

Global Accessibility:

Access market data and opportunities worldwide, anytime, anywhere.

Is This Stock Screener Free?

Yes! This Value Stock Screener, like all our core analysis tools, is completely free to use as often as you like. Our goal is to empower retail investors with high-quality tools for making informed decisions, regardless of their budget.

Further Information About Value Investing

Investopedia’s Value Investing article is an excellent starting point. Also explore our guides on Value Investing Principles and profiles of investors like Warren Buffett and Peter Lynch in our Learn section.

Found Potential Value Stocks?

Take the next step by performing in-depth analysis and valuation on your shortlisted candidates.

Analyze Company Fundamentals Calculate Intrinsic Value

Value Stock Screener Specific FAQs

Why are the default values set as they are (e.g., ROIC > 15%, Discount to FV > 30%, PEG < 1)?
These defaults are inspired by common quantitative benchmarks used by renowned value investors. For example: Remember, these are starting points; adjust the sliders to fit your specific criteria.
How is the 'Discount to Fair Value' calculated in this screener?
This metric provides an estimated discount based on a simplified DCF calculation using historical Free Cash Flow or Net Profit growth rates (capped at 20% p.a.) and standard assumptions (12% discount rate, 15x terminal multiple). It's a quick check for potential undervaluation but should be followed up with a detailed analysis using the Intrinsic Value Calculator with your own assumptions. See the full methodology here: Discount to Fair Value Calculation.
What does 'EPS Growth Stability' mean?
This filter assesses the consistency and reliability of a company's historical Earnings Per Share (EPS) growth over the past 10 years. Categories like 'Very High' or 'High' indicate more predictable past earnings growth, which value investors often prefer over highly volatile earnings.
Does passing this screener mean a stock is a guaranteed 'Buffett' or 'Lynch' pick?
No. The screener uses quantitative criteria inspired by their philosophies but cannot replicate their full analysis, which heavily includes qualitative judgments about management, moats, and future prospects. Use the results as a starting point for your own comprehensive research.

For general questions about using screeners, interpreting results, or limitations, please see our main guide: Guide to Using Stock Screeners FAQs.

How can we help you better?

Please tell us what improvements would make your experience on our website better? Feel free to provide details!